SUMMARY
Power grid operators can assess situational awareness using time-tagged measurements from phasor measurement units (PMUs) placed at multiple locations in a network. There have been several other use cases of post event analysis in the bulk power system using PMU based estimation applications such as parameter estimation, load modelling, and oscillation monitoring. However, as the distribution system is evolving to accommodate more DERs and EVs on the grid, its operation and control becomes increasingly challenging. PMUs produce 3 phase voltages, currents (phasor), frequency and rate of change of frequency at 10-120 samples per seconds. This rate is orders of magnitude greater than typical supervisor control and data acquisition system (SCADA) measurement rates. Utilities have not been equipped to handle this massive amount of data and enable applications that can run in real-time. Moreover, synchrophasor measurements are prone to anomalies that may impact the performance of phasor-based applications. Anomalies include any deviation from expected measurements resulting from power system events or bad data. It is necessary to identify these anomalies both for sensor fleet management reason to increase the percentage of good data captured by the PMUs and for downstream applications to run without problems.
Carrying out this function and producing data to enable real-time and off-line applications for the distribution grid requires a highly advanced communication infrastructure along with a scalable and performant platform than can accommodate PMU data. One of the other important tasks of the platform is its ability to host applications, including third party applications that can provide utilities more insights into distribution grid operation and planning. ComEd is working with partners to enable a cloud hosted PMU analytics platform called the PredictiveGrid platform. In this work we present the PMU data volume that will be produced over time, along with the performance requirement of a cloud hosted platform. We test and provide results on the performance of the selected PMU platform.
KEYWORDS
Big data, Distribution PMU, Synchrophasor, Continuous Point on Wave, Applications
1.INTRODUCTION
In 2015, ComEd initiated development of a roadmap and strategy for wide-scale operational use of Phasor Measurement Units (PMUs) and other types of time series sensor data in its transmission and distribution system. In this roadmap, more than two dozen distribution functions and applications were identified for PMUs along with several benefits and deployment challenges.
ComEd has plans to operationalize modern synchrophasor technology on the distribution system to improve its business operations. To date, ComEd has over 150 PMUs from more than 20 distribution substations streaming synchrophasor data to data centers. As PMU installation has streamlined and the number of PMUs and synchrophasor data availability are increasing, the focus is on a software platform to host data and deliver advanced applications and analytics exploiting synchrophasor data over the coming decade.
ComEd’s distribution synchrophasors data, applications, and analytics platform (the Platform) is a software and data management system that allows various ComEd business units to benefit from synchronized measurements across ComEd’s distribution system. In its distribution synchrophasor applications roadmap, ComEd looked at several power grid related functions in 5 general areas:
- Distributed Energy Resource (DER) Integration
- Distribution System Operations
- Wide-Area Monitoring, Protection, Automation and Control (WAMPAC)
- Asset Management and Reliability
- Planning and Analysis
In general, functions under DER integration, distribution system operations, and WAMPAC include real-time and near-real-time applications. In these applications, data access latency is critical as is the calculation time budget for results. Further, while these applications tend to need input data from a large number of streams, they usually only need the last few measurements. In contrast, asset management and reliability as well as planning and analysis applications are mostly (but not all) offline applications that do not have the same latency requirements but require large volumes of historical data. Thus, the two broad categories of utility applications stress the performance requirements of a data platform or data historian in fundamentally different ways.
In this article, we focus on the requirements of a data and applications platform that can host both simple and advanced applications, both model-based and data-driven, using ComEd distribution PMU and other types of time series sensor data. In the early stages, the focus will be on conceptualization and development of offline applications exploiting data analysis techniques to extract value from the available synchrophasor data and other time-series data. In due time, the platform will expand to support both offline and real-time applications using synchronized measurement data, with possible interactions between applications, e.g., the outcome of a near-real-time application may be used, together with historical PMU data, as input to another near-real-time application. Over time, as ComEd accumulates more data with significant diversity and duration, more advanced applications and analytics will be deployed.
2.PLATFORM REQUIREMENTS
The distribution data management and analytics platform requires an array of features and functionalities to be available or deployed over the course of this multi-year effort. Given the breadth of requirements, not all need to be fully operational during the early stages of this effort. For clarity’s sake, core platform requirements are considered short-term requirements while additional functionality is required longer-term so that the system design and choice of architecture are chosen up front to allow for easier transition to satisfy all known requirements in the future. As high-level guiding principles, some of the key priorities in designing and deploying this platform are detailed below.
Data Storage – Data loss or data deletion is not acceptable for at least the first three years of the effort until informed and function-relevant data retention policies can be developed. The following two charts put the volume of data into perspective as a function of sample rates, the first for synchrophasors with expected sample rates of either 30 or 60Hz, and the second for higher frequency point-on-wave sensing. Note that data volume is expressed in data points, a tuple containing a timestamp and a measurement value, instead of bytes because of the potential variability in bytes per data point caused by various storage and compression schemes.
| Time Period (years) | Sample Rate (Hz) | Number of Rows | Data Volume (number of data points) | |||
|---|---|---|---|---|---|---|
| 100 PMUs(2,000 columns) | 200 PMUs(4,000 columns) | 500 PMUs(10,000 columns) | 1,000 PMUs(20,000 columns) | |||
| 1 | 30 | 0.95 G* | 1.89 T* | 3.78 T | 9.46 T | 18.9 T |
| 1 | 60 | 1.89 G | 3.78 T | 7.57 T | 18.9 T | 37.8 T |
| 3 | 30 | 2.84 G | 5.68 T | 11.4 T | 28.4 T | 56.8 T |
| 3 | 60 | 5.68 G | 11.4 T | 22.7 T | 56.8 T | 114 T |
| MUs sampling at 14,400 samples per second | Number of Rows | Data Volume (number of data points) | ||
|---|---|---|---|---|
| 10 MUs(70 columns) | 100 MUs(700 columns) | 1,000 MUs(7,000 columns) | ||
| For 1 year | 0.45 T* | 31.8 T | 0.32 P | 3.18 P |
| For 3 years | 1.36 T | 95.4 T | 0.95 P | 9.54 P |
| For 10 years | 4.54 T | 0.32 P* | 3.18 P | 31.8 P |
*G stands for 109, T stands for 1012, and P stands for 1015
Scalability – synchrophasor data and other time-series sensor data (e.g., oscillography), as well as the number of applications using these data, will grow at higher rates in the future and new, faster sensor types may be added. The platform must be able to significantly scale both in data storage capacity and in compute capacity, supporting applications and analytical techniques known today and that could be developed in the future.
Performance – platform performance is intrinsically tied to scalability and a collection of real-world performance metrics for both real-time and historical applications must be developed and monitored. One of the most critical is the speed at which data points can be read from and written to storage as this fundamentally governs how the data can be used. The table below summarizes how long it would take to read one year of data for 100 PMUs at 30Hz as a function of the platform’s read performance. A platform that can only read 10,000 data points per second will take over six years simply to load the data into memory before any work can actually be done.
| Read Speed(data points per sec) | 1.89 TrillionData Points |
|---|---|
| 10,000 | 6.0 years |
| 100,000 | 7.3 months |
| 1,000,000 | 3.125 weeks |
| 10,000,000 | 2.1875 days |
| 100,000,000 | 5.25 hours |
| 1,000,000,000 | 31.5 minutes |
While not all use cases require every data point over the last year, some do, such as when training machine learning or AI algorithms. More importantly, it is critical that the platform in question not only be able to handle the analytics task at hand but also maintain normal operations to continue to ingest data and support other users and operation. Thus, performance requirements must substantially exceed those needed to support every day data ingest and management functionality.
Data Access Latency – Data access latency is the time between a request for data and receipt of the required data and is seen in two types of operations: (1) when requesting the most recent data (most likely from memory) and (2) when requesting historical data from persistent storage. Low latency is required not only to enable fast data queries for real time applications but also to decrease the iteration time when prototyping new use cases for data and overall application development.
Programming Language Agnostic – Performant data access is irrelevant if the language used to access the data is proprietary or unfamiliar or unavailable. To maximize the potential to create value from synchrophasor or POW data, all types of users and applications written in a wide variety of languages must be able to interact with the platform. Thus, Application Programming Interfaces (APIs) or Software Development Kits (SDKs) must be available in a wide variety of existing programming languages, both dynamic and compiled. Given the expected lifespan of the platform, it is anticipated that new programming languages will arise and must be supported as well. The ability to perform these tasks must be available to each user as a choice between at least one unrestricted, generalized programming language for automated customizable complex analysis and recording and a graphical user interface (GUI) for manual user interaction with and elemental operation on the same data with visual reporting or graphing.
Application Hosting – the platform needs to be able to host and run user-developed applications, supplying the application with the volume and velocity of data required to generate results, and potentially store the output of the application. Applications may vary in importance and mission critical applications must be prioritized over others.
3.PLATFORM INSTANTIATION
3.1Introduction
The platform selected by ComEd based on the above requirements was the PredictiveGrid platform, a cloud-based, software-as-a-service designed for the management, analysis, and application of time series sensor data at multi-petabyte scale. Originally designed as a distributed computing system, the platform is horizontally scalable to handle an arbitrary number of time series data streams with nanosecond temporal precision from different types of sensors. All systems are containerized, and Kubernetes is used for orchestration. The intention was to create a future-proof platform that could cost effectively handle the anticipated volume, velocity, and variety of time series sensor data and enable the data- and model-driven applications required by the energy transition. The figure below shows a high-level diagram of the system architecture and the platform’s core subsystems: ingress, storage, analytics, and access.
3.2Ingress
The platform’s ingress subsystem uses a fleet of data ingestors to receive, compress, pre-process, and insert measurements into the database. The compute needed to perform these tasks is distributed across multiple nodes. Increasing the number of ingress nodes causes the computational burden to be re-distributed among available nodes, enabling the platform to scale automatically to accommodate sensor growth without impacting performance.
3.3Storage
The storage layer persists both (1) time series data, including raw, full-resolution measurements and statistical aggregates for streamlined analytics, and (2) semantic data, including static geospatial information and sensor metadata, and records of system design and configuration. All data is versioned. Multiple storage subsystems are used but this paper focuses on time series data storage.
High sample rate and high-volume time series data poses a unique set of challenges for traditional relational databases and even scalable NOSQL data stores like Apache Cassandra. One of the critical metrics is the number of sensor measurements or data points the database can read and write per second per compute resource. The top contemporary time series databases can write approximately 1M points per second per node. For perspective, 800 PMUs, each with 20 streams of 60Hz high-precision timestamped measurements, generate nearly 1M points per second. Further, some utilities already have more than 5,000 PMUs deployed, not counting other sensors. Even if existing databases could handle the raw throughput required to ingest data from such a fleet, they cannot satisfy queries over large time ranges efficiently nor handle the analytical workloads particular to time series data. Thus, the PredictiveGrid’s time series database needed to be designed not just for the workload listed above but for ones that are 10x, 100x, and even 1000x larger.
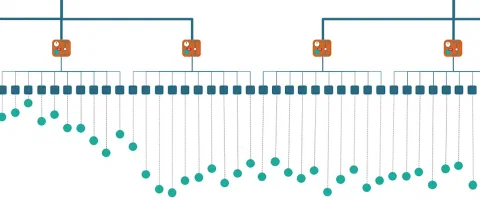
To meet the requirements described above, a novel data structure for time series data was created—a time-partitioning, copy-on-write version-annotated k-ary tree—and implemented by the Berkeley Tree Database (BTrDB). Sensor data is inherently temporal data queried based on time ranges. The use of a time-partitioning tree not only allows for the efficient location of specific points but also creates an implicit index to the data without additional storage space, increasing overall system throughput [1]. The latest internal benchmarks from 2021 recorded 25,883,615 and 13,671,534 data points per second per node read and write speed, respectively.
The raw measurements and timestamps are stored in the leaves at the bottom of this tree. Each parent node in the tree summarizes the child nodes below. These nodes store statistical aggregates that include the min, mean, max, standard deviation of the measurements as well as the count of the number of data points. As data changes, the relevant aggregates are efficiently recomputed in memory. The tree’s structure partitions time; thus, querying higher levels of the tree is asking the database for aggregations (rollups in time series parlance) over larger and larger time intervals. Thus, sensor measurements over a year, a month, a week, a day, a second are available nearly instantaneously to any user or application.
The tree data structure is copy on write; each time new data points are inserted a new copy of the tree becomes accessible. This allows the platform to retain all historical data and all versions of the tree require equal effort to access (there is no penalty for older versions of the data). A user can query the exact state of each data stream from any point in its past, much like version control for source code in such systems as Git. With versioning, a data stream can be “rewinded” to learn how data flowed into the system. Further, the database can be queried for a “change set”—the changes that have occurred since a particular version—enabling performant answers to questions like “what data has arrived since yesterday?”
The PredictiveGrid’s time series database persists data to a tiered storage system that blends different storage types—both an array of cloud-based and hardware-based such as spinning hard drives and SSDs—to yield desired price and performance characteristics (latency, throughput, etc). Data at every level of the tree is compressed using an enhanced variation of the Gorilla compression algorithm for time series data [2]. One current component of this storage fabric is CEPH, an open-source, distributed software storage platform, that implements object storage on a single distributed computer cluster [3]. CEPH has served as the foundational storage fabric for operational systems managing over 100 petabytes of data.
3.4Analytics
The platform’s multiple analytics subsystems have been built in anticipation of the various workloads required by different types of analytics needed to create value from large time series data sets. For this paper, we limit ourselves to three such systems that allow the rapid prototyping of analytics, the execution of pre-defined functions on triggering events, and the faster-than-real-time processing of out-of-core univariate and multivariate time series as well as extensibility to open-source analytics solutions.
Rapid Prototyping - Jupyter is an open-source platform for “reproducible computational workflows” and the de facto tool and development environment for data science, machine learning, and deep learning [4]. The name Jupyter comes from the three programming languages it has long supported: Julia, Python, and R. Jupyter also supports numerous additional languages, including MATLAB, C, and Scala, via different kernels that allow developers to work in their chosen language. Jupyter Notebooks contain both computer code (e.g. Python, R, MATLAB, or other languages) and rich text elements such as text paragraphs, equations, figures, URL hyperlinks, and even dynamic, interactive visualizations. Therefore, notebooks are human-readable and executable and include both the scripts used to perform data analysis as well as the results (figures, tables, etc.) and documentation text. These notebooks allow for rapid prototyping of new analytics use cases and provide a natural progression from exploration to report preparation for certain classes of analytics. While scripted code is not known for performance, the Jupyter Hub server is containerized and co-located with the rest of the platform, dramatically accelerating sustained query performance via data proximity.
User Defined Functions - User-defined functions are executed on the PredictiveGrid via an event processing library. This library allows authorized users to run arbitrary Python code (event handlers) at predefined events (also called hooks) within the platform. An example use would be running a transform or analytical process immediately after a new COMTRADE file has been imported into the platform.
After the event handler is executed, an email is sent to an email address supplied during registration. If successful, the email will contain any text returned by the Python function. If an exception is raised, then the handler code is regarded as unsuccessful, and a notification is sent with exception details. The process can also be configured such that “success” and “failure” notifications are sent to different email addresses. Alternative mechanisms of notification, such as SMS texting, are possible.
Out-of-Core Time Series Processing - DISTIL was created to enable the rapid development of scalable analytics pipelines with strict guarantees on result integrity despite non-synchronous data changes [5]. DISTIL is composed of two separate components.
- The distillers that implement the functions or transformations applied to the sensor data and
- The distillate processing framework that handles the performance optimizations and bookkeeping associated with multiple interleaved streams arriving at different rates, possibly out of order, chunking, buffering, scheduling and more.
Distillers are the “user-facing” portion of DISTIL, each containing a smaller kernel with two functions: (1) a precompute function that allows the user to specify the data needed for (2) the compute function that operates on the data and returns the computed values and associated time ranges. Each distiller can emit one or more new time series called derived streams or “distillates.” Derived streams are stored alongside other streams in the database, with the option to adjust parameters such as time-resolution, time history, precision, and sparsity to reduce cost while delivering stakeholder requirements. Alternatively, a distiller need not produce a time series but can instead output other data types as needed. This computational model covers a multitude of common algorithms and operations suited for time series data.
Distillers are written in Go and compiled. In benchmarking, tested distillers were able to run several orders of magnitude faster than real time, operating on 1,000 seconds worth of data in under a second. Moreover, everything is versioned: the data, the distillers, and the output streams. As one or more of the input streams change, the DISTIL framework determines what needs to be recomputed to produce consistent results with precise provenance and schedules the processing required to propagate the change through associated streams.
Extensibility via Open-Source Analytics Frameworks - Different organizations may already have experience with existing big data frameworks. Thus, managed clusters can be setup within the platform leveraging the following frameworks:
- Apache Spark (https://spark.apache.org/) is an open-source and unified analytics engine for large-scale data processing. Spark seeks to provide an interface for programming entire clusters with implicit data parallelism and fault tolerance. Spark has been aggressively commercialized by DataBricks.
- TensorFlow (https://www.tensorflow.org/ ) is an open-source end-to-end platform for machine learning with a specific emphasis on deep learning. It was developed by Google.
- Ray (https://ray.io/ ) is an open source, distributed execution framework that makes it easy to scale your applications and to leverage state of the art machine learning libraries.
3.5Access and Control
Data access is the foundation for all use of data, either by algorithm or expert. The PredictiveGrid platform provides programmatic APIs both for (1) data queries and data management and (2) user and ingress management. The API is easy to consume via gRPC or REST. The REST interface provides a nearly universal method to access the data. gRPC, Google’s open source, modern, and high-performance remote procedure call (RPC) framework, can run in virtually any environment and provides a high-performance API for the platform, allowing easy interactions with the underlying system for high performance services [6]. Currently the platform offers language bindings supporting Go, Python, C#, and Julia.
With great power to access data, comes great responsibility to control that access. Users can be given specific capabilities and permissions through group membership. Administrators can create new user groups, assign or modify group membership, and can control what functions members of each group can or cannot perform. Permissions are granted (or revoked) on the basis of “collections,” where a collection refers to a set of data streams. Administrators can control access to either the visualization interface or API and can govern each user’s ability to read, write, delete, and “obliterate” (permanently delete) data. Administrators may define unlimited user groups with differential access privileges granted to each. For example, user groups could include dataset owners, internal analysts, internal stakeholders, contractors, and external collaborators, where each group warrants unique permissions regarding visibility, accessibility, and control over the data.
4.QUALIFICATION TESTS AND RESULTS
As indicated in section 2, the requirements for the distribution data management and analytics platform were formalized before selecting the candidate platform, with consideration for functions to be served (both in the short term and in the long term). ComEd went through a Request for Information (RFI) and Request for Proposal (RFP) process to evaluate potential platform candidates. The RFI process included an 8-week demonstration stage, with focus on testing select key functionalities. The testing and demonstration included real-time streaming and ingestion of PMU and Point-on-Wave (waveform) data, as well as loading and access to historical data, API testing, data access speed validation and visualization. More specifically, the test suite for demonstration included:
- Realtime PMU Streaming
- 46 PMUs x 6 phasors @ 60 fps (15 channels per PMU)
- Latency estimation
- Point on wave streaming
- 1 MU x 6 channels @ 4,800 Samples/s (also tried 14,400 Samples/s)
- Historical Data Upload
- 46 PMUs x 6 phasors @ 60 fps for 1 month
- 1.7 TB of data
- Event Triggering (using APIs)
- Under/over voltage based on ‘patterning’ of real-time stream
- Realtime data viewing
- Near real-time applications, e.g., power quality and harmonics monitoring (using APIs)
The tests were conducted in close partnership between NuGrid and ComEd in the summer of 2021. In most cases, particularly for real-time tests, data was created or simulated in real time, with specific patterns, from NuGrid labs, streaming from NuGrid facilities in Burnaby, British Columbia, to PredictiveGrid hosted remotely in the cloud. The following figure shows a general architecture of the testing system for real-time functionalities.
We had 5 key objectives for the real-time streaming tests:
- Evaluate the data flow performance
- Observe latency
- Observe data quality
- Observe real-time access and visualization
- Evaluate technical support for each platform
Some of the data was intentionally patterned with cyclical-but-not-identical patterns to assist engineers in assessing test results. With the PredictiveGrid platform, initial setup was very easy and “just worked.” The testing team successfully streamed 46 PMUs (each with 15 channels of data at 60 measurements per second) from NuGrid facilities into PredictiveGrid platform deployed in Amazon’s cloud (servers in eastern US) for several weeks. No data drops were observed for a full test day of continuous streaming, including the C37.118 STAT words. The round-trip latency (including round trip network delays) was approximately 280 milliseconds. The testing team also successfully streamed continuous point on wave (waveform) data both at 4800 and 14,400 samples-per-second from one Merging Unit (MU) with 3-phases including both voltage and current. To evaluate the PredictiveGrid in a variety of settings, a variety of waveforms were created including function-generator-created waveforms (sinusoidal, square, and impulses) and output from a NuGrid 35-kV class optical voltage sensor energized with a real high-voltage signal that included natural distortions, noise, and harmonics existing in the supply source. All tests were successful.
In addition to real time streaming data, the team evaluated bulk data uploads. The test historical data set data, representing 46 PMUs over one month at 60/s or over 1.7 TB of time series data, took about 14 hours via a non-optimized import. This was much faster than available from other platforms ComEd has used (and has been further accelerated since testing in summer 2021).
The testing team also evaluated some of the analytics capabilities of the PredictiveGrid platform. We performed real-time power quality assessment, including the creation of spectrograms, using APIs provided by the PredictiveGrid platform via Python code scripted in the Jupyter notebook environment. The team also tested some alarming functions including over/under voltage alarms (and creation of an email alarm notice to end users). As an example, the following figure shows sample voltage violation alarms observed through setting user-configurable over-voltage and under-voltage alarm thresholds through an API.
5.CONCLUSION
Phasor measurement units can enable real-time application for effective monitoring and control of the dynamic distribution system. However, sensors alone are useless, and the measuring technology must be paired with an effective software platform that can ingest, store, and access the data from hundreds or thousands of sensors and deliver it as inputs to applications in real-time. With the evolving data system and cloud hosted data centres, a PMU platform hosted in the cloud provides utilities with the unique ability to utilize PMU and waveform data among multiple users in real-time and for historical analyses. PingThing’s PredictiveGrid platform was thoroughly tested by ComEd and NuGrid for its performance and ability to enable ComEd’s PMU roadmap. The complex testing procedure was accomplished over a period of 2 months and, as part of upcoming work, the PredictiveGrid platform will be deployed at ComEd to stream PMU data from over 250 PMUs and host and enable several real-time applications as well as offline analytic prototype development.
BIBLIOGRAPHY
- [1] Andersen M and Culler D, BTrDB: Optimizing Storage System Design for Timeseries Processing, Fast '16 14th USENIX Conference on File and Storage Technologies, Feb 2016.
- [2] T. Pelkonin, S. Franklin, J. Teller, P. Cavallaro, Qi Huang, J. Meza, K. Veeraraghavan, Gorilla: a fast, scalable, in-memory time series database. Proceedings of the VLDB Endowment, Volume 8, Issue 12August 2015 pp 1816
- [3] https://ceph.io/en/
- [4] Kluyver, T, et al.,, Jupyter Notebooks – a publishing format for reproducible computational workflows. p87 - 90, DOI, 10.3233/978-1-61499-649-1-87. Ebook Positioning and Power in Academic Publishing: Players, Agents and Agendas
- [5] Andersen M, Kumar S, Brooks C, von Meier A, and Culler DE. 2015. DISTIL: Design and implementation of a scalable synchrophasor data processing system. In Smart Grid Communications, 2015 IEEE International Conference on. IEEE, 271–277.
- [6] https://grpc.io/docs/