SUMMARY
As the number of sensors on the grid continues to grow rapidly, utilities’ inability to deal with the resulting volume, velocity and variety of data limits their efforts to unlock the value in these measurements. A third generation, domain-specific big data platform is required to enable utilities to efficiently and effectively leverage grid data to gain the insights they need to operate successfully in an environment of increasing indeterminacy.
In this work, we present such a platform architected to ingest, store, access, visualize, analyze, and learn from (train machine learning and deep learning algorithms with) data captured by an arbitrary number and type of sensors measuring the grid with nanosecond temporal resolution. Built with open-source tools to prevent vendor lock-in and benefit from the work of thousands of engineers, the platform uses a novel time series database that gives unprecedented ingestion and querying speeds. The platform also handles data quality, generally a major issue in power grid measurements, which enormously improves the ease of working with the data. Furthermore, the platform is designed to enable the rapid prototyping, implementation and deployment of novel analytics, machine learning, and deep learning applications. Finally, the platform’s convenient APIs and open interfaces encourage innovation while its user-facing applications, like the multiresolution plotter, enable data exploration and the dispersal of results—essential steps in the development of insightful and valuable data use cases. We believe that this platform will provide utility engineers, industry experts, and academic researchers with the ability to use sensor data to build the data driven grid of the future.
KEYWORDS
Big data, scalable analytics, time series data, sensors, artificial intelligence, machine learning, PMU
1.INTRODUCTION
1.1An Industry in Transition
As the indeterminacy and uncertainty in the electric grid increase, deriving intelligence from large, multi-modal sensor data sets will become essential for utilities’ operation, reliability, safety, and project execution. However, leveraging this data is difficult, precisely for the reasons the data sources are so valuable: the (1) volume, (2) velocity, and (3) variety of available sensor data substantially exceeds utilities’ data handling capabilities and the available technology offered by incumbent vendors.
(1) Volume - The number of sensors deployed on the grid has exponentially increased through specific utility programs, standardization, and industry market forces. Competition among vendors has driven product differentiation through the addition of sensing capabilities (i.e. multi-function relays) which do not dramatically increase the overall cost. This can be seen across asset types and vendors.
(2) Velocity - The physical processes underlying the grid are continuous in nature. Higher frequency sampling allows sensors to capture faster grid dynamics, yielding previously unavailable information about the physical processes in question. This is in stark contrast to the industries in which data science arose where measurement data amounts to discrete events—a tweet will arrive at a particular time stamp and additional useful information cannot be captured between arrivals. However, there is a real drive to capture higher frequency data from physical processes such as the voltage and current waveforms on the grid. PMUs, whose technology is now several decades old, offer continuous monitoring of both the transmission and distribution grid at 30Hz up to 240Hz. Further, point-on-wave or continuous waveform monitoring was a much-discussed topic at the 2018 IEEE PES General Meeting in Portland, OR and sensors are capturing continuous, streaming measurements at 32 to 512 samples per cycle (1920Hz to 30,720Hz).
(3) Variety - Sensors have been deployed across the grid with dogged pragmatism and financial restraint. They were not intended to capture data for what-if scenarios or analyses that might be useful someday. Instead, sensors are deployed to address known, impactful issues, with each one designed, built, and installed to address a specific, known problem. To make matters worse, the hardware companies who design and build sensors often develop the associated software, which can only handle data from a particular sensor type or potentially from a single manufacturer. Thus, data from each sensor, all measuring different characteristics of the same grid, reside within a fragmented, siloed environment that cannot provide a cohesive or integrated view of the system being measured.
This is in strong contrast to the “tech” companies that started and advanced data science such as Google, Facebook, and Amazon. During the operation of these digital-by-default businesses, the fundamental act of delivering online products and services created data, without explicit sensors, regardless of intention to address a known problem. This “data exhaust” was often captured because the core competencies of these contemporary tech giants were handling data.
Phasor Measurement Units - PMUs deployed across the transmission system are a notable example of the increased volume and velocity of grid sensor data. Official counts estimate the active US PMU fleet at approximately 5,000 active sensors. However, SEL has been incorporating phasor measurement capabilities into smart relays for nearly 15 years. The end result is that via SEL alone, there are over 500,000 smart relays deployed across North America that can serve as PMUs because of embedded functionalities. Further, many sensors now deployed are multi-functional in nature and can serve as two different types of sensor, often simultaneously. Thus, even smaller transmission utilities that have not made a concerted effort to deploy PMUs may already have hundreds of such devices installed and waiting to be turned on.
1.1 The Problem
The three “V”s described above compose a classic example of the big data problem that nearly every industry has or will ultimately face; eventually, the successful operation of the business requires an amount of data that exceeds the capabilities of a single machine (see Figure 1) and, more importantly, the software and data systems that have thrived in the industry to that point. Utilities face an essential transition to a new platform that can efficiently handle sensor data at scale and enable applications, especially ones using artificial intelligence (AI), that can extract value from this data. Tracing the evolution of the three generations of big data platforms highlights the solution to this problem.
First Generation - First generation big data systems are exemplified by Hadoop, which was originally an open source implementation of Google’s distributed file system and MapReduce data processing model, first publicly described in 2003 and 2004 respectively [1, 2]. Hadoop took advantage of the relatively inexpensive hard drives of the day and the vast bandwidth available when reading and writing data in parallel across a number of machines and hard drives. These systems began the trend of attempting to simplify the traditionally difficult task of distributed computing programming to increase the productivity and effectiveness of software engineers processing large volumes of data. Hadoop was designed for batch analytics, with large but finite data sets, to enable traditional business intelligence.
Second Generation - The rise of machine learning spurred the development of a second generation of general-purpose big data systems exemplified by Apache Spark [3]. Machine learning algorithms often require vast amounts of data to be successfully trained and the training process is inherently an iterative process, converging to an enhanced solution. Spark accelerates this process by keeping everything in memory, whereas Hadoop would write the results of each mapper and reducer to disk. Where Hadoop leveraged the relative low cost of hard drives, Spark took advantage of the relatively low cost and, therefore, plentiful RAM or main memory available at the time the platform was architected. During this generation, the need for systems capable of handling streaming data arose, with data sets continuously growing without bound and requiring immediate processing to produce actionable output.
Third Generation Big Data Platforms - Each generation of big data platforms was built considering the economics of solving the relevant problems of its day given the constraints of contemporary computing hardware. The state of the art has moved beyond both first generation—Hadoop’s general-purpose batch processing—and second generation—general purpose big datastores and processing frameworks such as Cassandra and Spark—big data platforms to third generation systems. Third generation platforms are purpose-built with specialized data structures and architectures optimized for a particular type of data, specific analytic use cases, and tailored to the eccentricities of particular industries. Not only are they far more efficient at processing their specific type of data and computing relevant analytics, they demand far less effort by the analysts and engineers faced with those highly specialized problems.
| Generation 1 | Generation 2 | Generation 3 | |
|---|---|---|---|
| Technologies | Hadoop | Spark | Domain Specific |
| Supported Workloads | Batch processing | Iterative processing | Continuous processing |
| Analytic Paradigm | Classic business analytics | General Machine Learning | Specialized ML and Deep Learning |
| Differentiating Features | MapReduce, Disk oriented, General purpose | In memory, Better tooling | Data type specific, Industry/application focused |
| Limiting Reagent | Disk bandwidth | Memory capacity | Compute |
For example, take the problem of hammering in a nail. While a Swiss Army knife may have a suitable attachment, a standalone hammer would be more efficient at the task because the knife is weighed down by its other capabilities. If the original problem is hammering in one thousand nails, the better tool would be a nail gun: a tool more complex than the simple hammer but purpose built for this scale of task to accelerate the worker’s capabilities. For this reason, general purpose big-data platforms provide lots of flexibility with little optimization for specific use cases at scale. The focus of a 3rd generation big data platform is to solve a particular industry’s unique problems in a highly cost-effective fashion. The remainder of the paper describes one such third generation big data system designed to handle time series data streaming from an unlimited number of utility sensors.
2.A UNIVERSAL SENSOR ANALYTICS AND AI PLATFORM
The universal sensor analytics and AI platform is horizontally scalable and architected to ingest, store, access, visualize, analyze, and learn from (train machine learning and deep learning algorithms with) data captured by an arbitrary number and type of sensors measuring the grid with nanosecond temporal resolution. This platform’s system diagram is detailed in figure below.
The platform can be decomposed into several functional areas. Moving from left to right in the diagram, it supports the ingestion of both streaming and historical data archives in a wide range of formats at scale via the ingest engine. Data is ingested into a database specifically designed for dense time series sensor data, the Berkeley Tree Database (BTrDB) whose development was funded by the ARPA-E Micro Synchrophasors for the Distribution System project. Further, the platform contains a distributed analytics and computational framework designed to operate across time series in parallel, executing significantly faster than real time to handle both real time and historical analyses and the training of machine learning and deep learning algorithms. The platform provides numerous APIs that provide not only a direct connection for web applications including a data explorer, dashboards, and Jupyter Notebooks for ad-hoc analytics but also to utility planning and operations software, allowing for the seamless integration of highly novel algorithms with the real world. The sections below will describe each component in detail.
Note that this platform extensively leverages open source software and non-proprietary data formats to prevent vendor lock-in and allow the community to develop and expand the available tooling. Using open source software is a necessity as it lowers the total cost of platform development by leveraging the efforts of literally thousands of software engineers at almost no cost. Further, these teams of programmers will continue to improve and evolve each software component over time.
2.1Ingest Engine
The platform’s ingest engine handles two general types of data ingest each with unique requirements. The first type is data continuously streaming from real or virtual sensors. For streaming data ingest, the platform supports a broad range of standards including the nearly ubiquitous IEEE C37.118 for phasor measurement units and also file-based data transfers. The following transport and message protocols will be supported in the near future for data ingestion: GEP, IEC 61850, Modbus, DNP3, GOOSE, and GSSE. The platform’s open-source and modular nature allows for third-party contributions, speeding support of new protocols. As the number of sensor data formats is large, the ingest engine’s ability to rapidly develop and test data import from a new format is key. Equally important are tight, continuous data quality assessments of the actual sensor measurements to identify immediately any potential errors, including those in the ingestors.
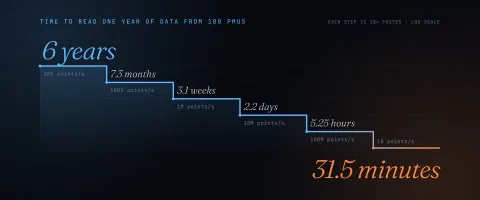
Large archives from historians and other legacy systems are the second type of data that must be ingested by the platform, often for retrospective data analyses or to pre-populate the platform before receiving new streaming data. These data files, often terabytes in size, arrive in archive formats such as COMTRADE, Open Historian version 1 (.d files) and version 2 (.d2 files), and comma separated value files (CSV). Along with these common formats are several vendor- or utility-specific formats like PDAT developed at Bonneville Power Authority (BPA). As these large archives often represent multiple years of data for an entire utility, ingest must occur significantly faster than real time. Even at 100x real time, a year of historical data still requires over 3.5 days to be ingested into a platform.
2.2Time Series Database
High density telemetry or time series data, composed of measurements taken over regular time intervals with high resolution timestamps from electric grid sensors, provides a unique set of challenges for traditional relational databases and even scalable NOSQL data stores like Apache Cassandra. One of the critical metrics is the number of sensor measurements or data points the database can read and write per second per compute resource. The top contemporary time series databases can write approximately 1M points per second per node. For perspective, two hundred PMUs, each with 40 streams of 120Hz high-precision timestamped measurements, generate nearly 1M points per second. Further, some utilities already have more than 5,000 PMUs, not counting other sensors. Even if existing databases could handle the raw throughput required by existing sensor deployments, they cannot satisfy queries over large time ranges efficiently let alone handle the analytical workloads particular to time series data. Thus, the heart of this universal sensor platform needed to be designed for at least this level of performance to ensure that the necessary capabilities - extremely high throughput, fast response times for queries across time scales from milliseconds to years, and the ability to handle messy, out-of-order, real world sensor data and its implications for analytics - are available [4].
To meet the requirements described above, a novel data structure for time series data was created—a time-partitioning, copy-on-write version-annotated k-ary tree shown in Figure 3—and implemented by the Berkeley Tree Database (BTrDB). Sensor data is intrinsically temporal data queried based on time ranges. The use of a time-partitioning tree not only allows for the efficient location of specific points but also creates an implicit index to the data without additional storage space, increasing overall system throughput [4].
The raw measurements and timestamps are stored in the leaves at the bottom of this tree (see Figure 3). Each higher level of the tree summarizes the child nodes below it. These nodes store statistical aggregates that originally included the min, mean, max and count of the number of data points. As data changes, the relevant aggregates are all efficiently recomputed while in memory. As the tree itself represents time, querying higher levels of the tree is asking the database for aggregations (rollups in time series parlance) over larger and larger time intervals. Thus, sensor measurements over a year, a month, a week, a day, a second are available nearly instantaneously to any user or application [4].
The tree is copy on write; each time new data points are inserted a new copy of the tree is made accessible via a new root node. This allows the platform to retain all historical data and all versions of the tree require equal effort to access (there is no penalty for older versions of the data). A user can query the exact state of each and every data stream from any point in its past, much like version control for source code in such systems as Git. Thus, a data stream can literally be “rewinded” to learn how data flowed into the system. Further, the database can be queried for a “change set”—the changes that have occurred since a particular version—enabling performant answers to questions like “what data has arrived since yesterday?”
All of these innovations have led to the creation of a time series database at the heart of the universal sensor platform that has state-of-the-art performance. Early benchmarks demonstrated a throughput of 53 million inserted values per second and 119 million queried values per second on a small, four-node cluster. More recent testing has shown that the system can support over 100,000 simultaneous PMUs, each providing at least 20 streams of 60Hz data. Since these benchmarks were taken, numerous improvements have been made to the database and these numbers are considered a lower bound. Additionally, the database itself has been fully parallelized so that additional nodes can be added to handle extra sensors without any performance decrease.
Data Quality - Sensors exist in the real world and the resulting measurements can suffer from numerous data quality issues arising from communication problems, misconfigurations, hardware errors, and more. Extensive analysis of early transmission PMU data highlighted that data quality was a pervasive problem across multiple utilities [5]. As the quality of the data impacts all downstream analyses and applications, some more sensitive than others, data quality must be an intrinsic part of the universal sensor platform. Current data quality reporting is primarily surfaced via bit flags contained within the C37.118 protocol. The universal sensor platform evaluates the measurements’ data quality directly and in real time before the data is persisted to storage. The results of this analysis are manifested as additional, sparse data streams also stored in the time series database. Thus, the data quality results are precomputed and co-located with the original sensor data, always available to inform those algorithms and applications dependent upon it.
Data Compression - Lossless compression reduces the storage requirements and consequently the financial burden of high frequency sensor data while still preserving the full fidelity of the measurements for future use. While lossless time series compression is a well-developed field, many existing algorithms have not been applied to grid data. Compressing PMU data is a priority due to the associated data volume and the fact that the behavior of the underlying physical process follows well understood statistical distributions, offering high compressibility. Klump explores the performance of off-the-shelf algorithms on PMU data [6]; however, these algorithms compress complete data sets after the data has been collected (as is done on images). Other proposed algorithms for PMU data compression [7, 8], leverage the low dimensionality of PMU measurements to achieve high compression ratios but also require non-streaming data and are lossy. A universal sensor analytics platform must be able to compress streaming, floating-point data in a lossless fashion, rather than compressing the complete data set after it is recorded. A scheme with these attributes is described by Andersen in 2016 as part of the original BTrDB implementation. It achieves an average compression ratio of 2.9 for PMU sensor measurements. This algorithm has since been evolved using techniques from other fields to approach a lossless compression of up to 10 to 1.
2.3Analytics, Machine Learning, and Deep Learning
Moving computation to the data is one of the hallmarks of big data systems and processing time series data at scale is no different. Thus, analytics and machine learning must be core components or “first-class citizens” of the platform. This is one of the fundamental reasons why it is impossible to add or “bolt on” real time analytics, let alone machine learning capabilities, to legacy systems with non-scalable architectures. Further, processing real world sensor data at scale brings additional, unique challenges for analytics.
The analysis of sensor data occurs in one of two modes: (1) real-time, processing the data as it arrives (synchronously) or (2) retrospective or historical, processing a fixed amount of the data after it has arrived into the system (asynchronously). Both require rapid processing of the data. However, real time (1) processing establishes an explicit time budget for each computation, much like rendering a three-dimensional scene in a movie or video game at 30 frames per second. For the movie or game to not stutter, each frame must be completed within 1/30 of a second. A sensor analytics platform that offers real time processing must offer such processing to all streams. While processing a single stream in real time may seem trivial, handling a million streams in real time is not and requires orders of magnitude additional computational resources and bandwidth. Retrospective or asynchronous processes often require the analysis of a large volume of data significantly faster than real time.
Many traditional engineering analytics for sensor data apply a function to each data point or window of data points in one or more time series. A simple example of this is the calculation of frequency from phase angle data. Frequency is computed from a single input time series as the derivative of the phase angle measurement. A more complex analytic example is reactive power, which is computed from four measurement time series: the voltage and current phasors each consisting of a magnitude and a phase angle. However, analysis often requires the application of not one but a sequence of such functions. For example, a cleaning algorithm may first remove anomalous measurements from a voltage magnitude stream and then the “cleaned” version is passed through a function to compute the fundamental power. A universal sensor analytics platform must apply and orchestrate these types of functions in the appropriate sequence to thousands of data streams simultaneously while handling out-of-order updates to the individual data streams all in real time or to large historical data sets.
To meet these requirements, DISTIL was created enabling the rapid development of scalable analytics pipelines with strict guarantees on result integrity despite non-synchronous data changes [9]. DISTIL is composed of two separate components:
- distillers that implement the functions or transformations applied to the sensor data and
- the distillate processing framework that handles the performance optimizations and bookkeeping associated with multiple interleaved streams arriving at different rates, possibly out of order, chunking, buffering, scheduling and more.
Distillers are the “user-facing” portion of DISTIL. At the heart of each distiller is a smaller kernel that contains two functions; (1) the precompute allows the user to specify the data needed for the (2) compute function that will operate on the data and return the computed values and associated time ranges. Each distiller can emit one or more new time series called “distillates” that are fed back into BTrDB. This computational model covers a tremendous number of potential algorithms and operations that can be performed on time series data.
This architecture focuses on efficient and reliable calculation and storage of these “distillates” in advance of queries, rather than just-in-time materialization. The advantage is that many months or years of analytical results can be queried in milliseconds. Moreover, everything is versioned: the data, the distillers, and the intermediate streams. As a change occurs, the framework determines what needs to be recomputed to produce consistent results with precise provenance and schedules the processing required to propagate the change through associated streams. Figure 4 shows numerous distillers cleaning and transforming voltage and current phasors and feeding the generated data streams into additional distillers to facilitate more complex analytics and calculations.
2.4APIs and Open Interfaces
While storing and archiving data to meet regulatory requirements is key, the platform must also make the data usable and consumable by other applications so that it is extensible not just by the software vendor but also by customers and users. The quality of an API is important because it will either encourage innovation and simplify application development or introduce persistent friction into development efforts. Excellent design, then, tends to mean two things. First, the system exposes a set of well thought out primitives that can be composed to create functionality and address present and future use cases. Ideally, the set of operations available to third party developers is the same set available to core developers. Second, this API should be broadly available in as many target environments and languages as possible, making it easy for applications to work with in an idiomatic way.
The universal sensor analytics platform satisfies both requirements. All applications on the platform are built using the same robust set of operations available to any 3rd party application. The API is easy to consume via REST or gRPC. The RESTful interface provides a nearly universal method to access the data with results returned as JSON. This interface powers many web applications built atop the platform. gRPC, Google’s open source, modern, and high-performance remote procedure call (RPC) framework can run in any environment and provides a high-performance API for the platform allowing easy interactions with the underlying system for high performance services [10]. Further, gRPC’s nearly universal availability across languages powers an equally broad array of language bindings with the platform’s simple to use yet performant Python bindings being one such example.
2.5User-Facing Applications
Users’ needs can vary broadly, driven by the specific demands of their business and workflow. As a simple example, some users will want to view the raw data via dashboards while others may want to explore the data as a precursor to programmatic analysis. In closed systems, this can lead to overly complex software in an effort to cover as many use cases as possible despite the steep cost to usability. In contrast, an open system can expose powerful primitives that enable the creation of specialized tools capable of making the best tradeoffs for their intended audience. The key to creating high-value, user-facing applications is two-fold. First, the underlying design of the platform must consider many use cases, even those not yet conceived of. Second, a set of basic yet performant user-facing applications must come packaged with the platform for out-of-the-box usability. By default, the platform includes a multi-resolution plotter for interactive data exploration and Jupyter Notebooks for ad-hoc analytics to fully enable the end-to-end analytics pipeline.
Interactive Data Exploration (Multi-Resolution Plotter) - “Overview first, zoom and filter, then details-on-demand.” - This short mantra from Shneiderman et al provides a terse summary of how users explore large data sets and provides an excellent framework for designing information visualization applications [11]. To enable this best practice, the platform enables high performance visualization and real time interaction on arbitrarily large data sets. The classic trade-offs faced by visualizers between quantity of data and time-to-render are circumvented by taking advantage of key design decisions in the underlying database. Specifically, the ability to query data at variable time resolutions with consistently low latency allows the visualizer to request the ideal amount of data for display (1 data point per pixel). By breaking the relationship between the quantity of data and query latency, fully interactive visual exploration is possible. Furthermore, visualization of real time data and even updates to past data are trivially accomplished due to the database engine’s decision to version streams. Finally, algorithms for intelligently prefetching the data a user is likely to view next as well as caching strategies further enhance perceived performance [12].
Customizable Real-time Dashboards (Grafana) - Many user-facing applications, regardless of the intelligence behind them, can and will take the form of a real-time dashboard. Dashboards are a quick and effective way both to prototype and deploy production interfaces for non-programming users such as utility leadership and control room operators. There are also many great open source approaches to dashboarding, such as Grafana [13], that only require an integration layer to connect and thereby remain consistent with the platform design philosophies.
Ad-Hoc Analytics (Jupyter) - Jupyter is an open source platform for “reproducible computational workflows” that has become the de facto tool and development environment for data science, machine learning, and deep learning [14]. The name Jupyter comes from the three programming languages it has long supported: Julia, Python, and R. Jupyter also supports numerous additional languages, including MATLAB, C, and Scala, all through different kernels that allow developers to work in the language in which they are most comfortable. Jupyter Notebooks contain both computer code (e.g. Python, R, MATLAB, or other languages) and rich text elements such as text paragraphs, equations, figures, URL hyperlinks, and even dynamic, interactive visualizations. Therefore, notebooks are human-readable and executable and include both the scripts used to perform data analysis as well as the results (figures, tables, etc.) and documentation text. These notebooks allow for rapid prototyping of new analytics use cases and provide a natural progression from exploration to report preparation for certain classes of analytics.
3.CONCLUSION
This paper has provided an overview of a state-of-the-art platform to ingest, store, clean, visualize, and process grid sensor data, making the data easily accessible to enable artificial intelligence analytics as a first-class citizen. The platform is horizontally scalable, able to ingest sensor data streams from millions of sensors simultaneously while also supporting asynchronous training and analytic tasks. The open platform is composed of open source software components with open data formats. It can be deployed both behind corporate firewalls as an appliance or run as a platform-as-a-service in a major enterprise cloud for reliability, resiliency, scalability, accessibility, and reduced cost.
The word “universal” in the title of this paper has multiple, intended meanings. Most obviously, the platform was architected to be the platform for any and all sensor data that reports timestamped measurements that inform grid operators, planners, and designers. These sensors could range from digital fault recorders sampling the voltage and current waveforms at 100KHz to residential smart meters reporting measurements every 15 minutes. Thus, the platform is universal to include all different types of smart meter data.
However, and of far greater importance, the word “universal” is an adjective directed at the intended user base. While utilities are the primary user of this platform for sensor analytics and artificial intelligence, universities, independent researchers, consulting firms, national laboratories, and other groups also have strong vested interest in helping to create the grid of the future. Therefore, in order to rapidly transfer new algorithms and analytics from theory to practice, it makes sense to have all of these groups inventing, prototyping, testing, and developing on the same platform. We want to create a large, inter-utility and inter-organization community that builds an ecosystem of shared and common tooling for leveraging data to enhance the efficient, resilient, and reliable operation of the grid. We seek to build a true platform, where the overall industry’s “[s]trategy has moved from controlling unique internal resources and erecting competitive barriers to orchestrating external resources and engaging vibrant communities. And innovation is no longer the province of in-house experts ... but is produced through crowdsourcing and the contribution of ideas by independent participants in the platform” [15].
BIBLIOGRAPHY
- [1] Ghemawat, S., Gobioff, H., and Leung, S. The Google File System. Proceedings of the Nineteenth ACM Symposium on Operating Systems Principles - SOSP '03(2003).
- [2] Dean, J. and Ghemawat, S. 2004. MapReduce: simplified data processing on large clusters. In Proc. of the 6th conference on Symposium on Operating Systems Design & Implementation - Volume 6 (OSDI'04), Vol. 6. USENIX Association, Berkeley, CA, USA, 10-10.
- [3] Matei Zaharia, Mosharaf Chowdhury, Michael J. Franklin, Scott Shenker, and Ion Stoica. 2010. Spark: cluster computing with working sets. In Proceedings of the 2nd USENIX conference on Hot topics in cloud computing (HotCloud'10). USENIX Association, Berkeley, CA, USA, 10-10.
- [4] Andersen M and Culler D, BTrDB: Optimizing Storage System Design for Timeseries Processing, Fast '16 14th USENIX Conference on File and Storage Technologies, Feb 2016.
- [5] Murphy SP, Rhodes M, Schuman J, and Leis A. Understanding and Analyzing Synchrophasor Data Quality at Scale, NASPI Working Group Meeting, Gaithersburg, MD, March 2017
- [6] Klump, Ray, et al. "Lossless compression of synchronized phasor measurements." Power and Energy Society General Meeting, 2010 IEEE. IEEE, 2010.
- [7] Gadde, Phani Harsha, et al. "Efficient Compression of PMU Data in WAMS." IEEE Transactions on Smart Grid 7.5 (2016): 2406-2413.
- [8] Wang, Meng, et al. "A low-rank matrix approach for the analysis of large amounts of power system synchrophasor data." System Sciences (HICSS), 2015 48th Hawaii International Conference on. IEEE, 2015.
- [9] Andersen M, Kumar S, Brooks C, von Meier A, and Culler DE. 2015. DISTIL: Design and implementation of a scalable synchrophasor data processing system. In Smart Grid Communications, 2015 IEEE International Conference on. IEEE, 271–277.
- [10] https://grpc.io/docs/
- [11] Paolo Buono, AleksAris, CatherinePlaisant, Amir Khella, Ben Shneiderman, H Hochheiser, and B Schneiderman. 2005. Interactive pattern search in time series. In Proc. SPIE Conference on Visual Data Analytics, Vol. 5669. 175–186.
- [12] Kumar S, Michael P Andersen, and David E. Culler, Unifying data reduction in storage and visualization systems, SIGMOD’18, June 2018, Houston, Texas, USA
- [13] http://docs.grafana.org/reference/
- [14] Kluyver, T, et al.,, Jupyter Notebooks – a publishing format for reproducible computational workflows. p87 - 90, DOI, 10.3233/978-1-61499-649-1-87. Ebook Positioning and Power in Academic Publishing: Players, Agents and Agendas
- [15] Parker G, Van Alstyne M, and Choudary SP. P. Platform Revolution: How Networked Markets Are Transforming the Economy, W. W. Norton Company February 22, 2016