SUMMARY
With the advent and subsequent deployment of synchrophasor technology over the last two decades, the electric utility industry has made a significant and public investment to move toward a more data-oriented future. We will argue that all of the necessary ingredients are now available to leverage this data to produce far greater ROI than had originally been anticipated. While not yet adequately addressed, data quality is a solvable issue; it is not a technology nor algorithm problem, but one of organizational will. Significant motivation to use PMU and other next generation sensor data exists in many forms. PMU data can clearly be used to reduce unnecessary costs for utilities and even previously unknown use cases such as GMD monitoring, are possible. Finally, other industries have evolved the state of the art in distributed compute and storage systems to surpass the current needs of the utility industry.
KEYWORDS
data science, Phasor Measurement Unit, synchrophasor, predictive analytics, time series data, real time stream analytics, data quality
Introduction
The phasor representation of current and voltage was first published in 18931. Nearly a century later, the phasor measurement unit (PMU) was invented at Virginia Tech and, in 1995, the IEEE published the first PMU data specification2.The Department of Energy and the Office of Electricity Delivery and Energy Reliability, with the help of the American Recovery and Reinvestment Act of 2009, pushed $357 million to the appropriation and deployment of PMUs across the US power grid. From 2009 to 2015, there number of networked PMUs in the United States of America has grown over 900%, from 166 to over 1,7003.
While PMUs went from inception to deployment in two decades, the proliferation of next generation sensors is increasing. Major hardware manufacturers, such as Schweitzer and GE, are embedding synchrophasor-type sensing into many previously non-instrumented grid components. As new equipment is bought and old equipment is replaced, the number of sensors on the transmission grid will increase regardless of utility intention. While synchrophasors have long been associated with the transmission side of the grid, we are seeing micro-synchrophasors or µPMUs bringing comparable but enhanced monitoring to the distribution side of the grid4. Further, numerous other data sources external to the utilities have become increasingly relevant to the optimal functioning of the grid. Sources such as the magnetometer data feeds from the United States Geological Survey, the planetary K index provided by the Space Weather Prediction Center, and the magnetotelluric data provided by Earthscope provide insight into the behavior of the nation’s power grid.
This increase in sensor penetration on the grid has been met with a corresponding increase in academic focus. Google Scholar currently reports a total of 5,350 papers with references to synchrophasors worldwide. As shown in the bar chart below, patents and papers have been on a steady increase for the past decade as synchrophasor technology matures and manifests itself in different locations within the bulk power system, such as relays and intelligent electrical devices (IEDs).
Similarly, the number of books focused on synchrophasors has seen a corresponding and steady rise; Amazon now reports thirty-seven books available on this subject matter.
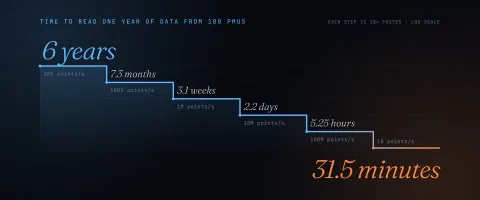
Given this two-decade trajectory of growth, it is natural to ask, where is the power industry now? The 1,700 networked synchrophasors capture a terabyte of data per month describing, in detail, the complex behavior of this critical infrastructure that allows our modern society to function. How is this data being used? Is it being used? While many would not consider a terabyte “web-scale” data, it is larger than the utility industry is accustomed to and taxes the capabilities of current tooling. To put this into perspective, Google was fusing over 20 petabytes of data (or 20,000 terabytes) in 2012 to provide Google Maps as a free service to consumers. Powering Google maps was a wide array of data including satellite imagery from government and third party providers, millions of sensors embedded in roads in each state, and video, LIDAR, and 65-megapixel images collected by its Street View vehicles5. Even though the utility sector is an industry that has always leveraged data, it seems hesitant to take the next step.
In 2006, the understanding of the value of data was being discussed by many: “Data is just like crude. It’s valuable, but if unrefined it cannot really be used. It has to be changed into gas, plastic, chemicals, etc. to create a valuable entity that drives profitable activity; so must data be broken down, analyzed for it to have value.6” To unlock the value of the data that PMUs and micro PMUs and other sensors are collecting, utilities need to build applications that are driven by this data to solve problems of interest. To enable this capability, there are several fundamental requirements. First, to use data, the utilities must have data and the quality of the data must be good. Second, the industry must be motivated by the appropriate use cases. Finally, with sufficient motivation and high quality raw material, utilities must have access to the capability to store, understand, and use data at scale. The goal of this paper is to overview these requirements and offer an in-depth exploration of each, demonstrating the time is ripe for data-driven applications to help re-invent the US power grid.
1Raw Material - Data Quality
Data is the raw material upon which applications are built and the value that can be created by such data-driven applications is a function of the quality of the underlying data. High quality data that accurately describes the state of the system can be used to train a host of machine learning algorithms to power applications. At the other end of the spectrum, bad data cannot; as they say in computer science, “garbage in, garbage out.”
While there is currently debate and effort to understand the impact of varying levels of data quality on various applications of the data, this somewhat premature. As the United States Supreme Court Justice Potter Stewart said about the threshold for obscenity:
“I shall not today attempt further to define the kinds of material I understand to be embraced within that shorthand description, and perhaps I could never succeed in intelligibly doing so. But I know it when I see it, and the motion picture involved in this case is not that.”
The same holds true for data quality. There is good data and then there is bad data and, currently, there is little question when data is bad. PMU sensors should not report months of negative, identical floating point values for the magnitude of the voltage phasor on the high side of an energized transformer. If so, there is a data quality problem that needs to be resolved. In fact, PingThings recently did a survey of data quality for PMU data collected from dozens of utilities across North America; the plot below shows the results.
INSERT PLOT
Beyond not driving value creation, bad data can be considered an organizational liability. Spending significant resources installing high-fidelity sensors and the data storage systems required to at least archive the data and then finding the historian contains ten terabytes of universally bad data is not a best practice in any industry. Worse, it is conceivable that such behavior could open an awkward line of questioning from regulators, policy makers, or even consumers, especially when public funds contributed to the initiative. Once the problems of data quality have been addressed, there is an expectation that good data will be used for applications beyond archiving; the data genie is out of the bottle.
1.1Wrangling Data Quality
Several different products in the marketplace offer data quality assurance for synchrophasor applications including Grid Protection Alliance’s PDQ Tracker, the Electric Power Group’s DataNXT, and PingThings’ PredictiveGrid:DQA. Each evaluates the quality of PMU data via a number of metrics. In simplest terms, data quality can be measured by the percentage of data that is considered obviously bad. Time series values that are obviously bad include:
- Null values
- Missing values
- Zero values (not all zero values are bad, but most are)
- Repeated values (the probability of seeing two sequential and identical 32-bit or 64-bit floats produced by a sensor monitoring a physical process is low)
- Values outside the range of possible values as dictated by physics
More advanced criteria can be used to identify additional data issues but will not be expounded upon in this paper.
One-off reports providing a snap-shot of data quality are an efficient vehicle for identifying and locating the initial set of problems that plague data quality. However, eventually equipment fails, topologies change, and events occur. With high probability, some event will impact data quality and,. if the data is not monitored in real-time, bad data will flood the system, impacting all downstream dependencies. Real-time applications require continuous monitoring of the quality of the data. Further, the data quality monitoring must inform the applications using the data as operators must know how much and when they can trust the results that are produced.
2Motivation
Data can become an asset for the industry once the quality issue is solved. As sensor measurements are just another type of data, collecting power grid is comparable to accruing assets. With enough measurements, an organization enters “big data” territory. The three defining characteristics of big data are the three V’s - Volume, Velocity, and Variety. Volume simply speaks to the amount of data, measured in bytes that can be leveraged, with terms such as Exabyte (1,000,000,000,000,000,000 bytes or 1018 bytes) entering the vernacular. Velocity refers to the rate at which new data is created, something directly relevant to the faster data rates provided by synchrophasors and Variety indicates that data now comes in many flavors, not all of which can be stored in a spreadsheet. Occasionally, data quality is included as a fourth V, for Veracity.
While it is true that “big” data is significant in amount, this size is always relative to the available tool and skill sets. The term “big data” has resonated with society because data has become a “big” deal. Where scientists and engineers have long known that data was useful, the rest of the world, including management and even government, have realized that data can create value, be it financial, environmental, and/or social value and the only V that matters is “Value.”
2.1Value Creation
Data can be used to quantify aspects of the real world, creating highly detailed models capable of producing insights, understandings, or predictions of the past, present, or future behaviors, respectively, of the system. These views can be captured and scaled by data-driven applications that are increasingly valuable, as shown in the figure below as a function of cost.
Note that we are talking about data-driven applications or data products. In contrast, reports are a product-built-from-data with which most are familiar; data has been collected and collapsed into meaningful prose and visualizations to convey a message from one person or group to another. Academic journal articles are another such example. Data products are at the other end of the spectrum of scalability. In a data product, the result or conclusion is repeatedly created on demand via a completely automated system. Compared to the traditional report, all steps that were required to generate results now live within computer code with all data sources programmatically accessible.
Let’s explore each shaded region above in the context of utilities. The first wave of data-driven applications typically focus on the past, diagnosing events that have already impacted the system. Utilities are no stranger to post event investigations and understand the associated value proposition. Studies have shown that PMU data can help accelerate the findings of a such investigations, shrinking the time required from months to weeks7. The southwest blackout in 2011 was one of the first examples where synchrophasor data was used to quickly determine the cause of the outage. From a technical standpoint, this is the easiest time period to address so long as the data has been archived successfully and is of sufficient quality.
The contemporary control room is an excellent example of a data application that describe the present moment in time. Such applications often require large volumes of data be compressed and summarized for human consumption and response. To date, control rooms are dominated by data from SCADA systems.
The most valuable data-driven applications focus on predicting and then prescribing the future. It is in these areas, the right most shaded regions in the figure above, where PMU data will most likely shine. Compared to SCADA data offering information every few seconds about the grid, it is far more likely that here-to-for undiscovered patterns that are predictive of crucial system behaviors will be discovered in PMU data, where the actual behavior of the system is being record 30 to 60 times a second. It is clear that the knowledge that an asset requires maintenance or will fail is potentially worth billions of dollars to the utility industry.
2.2Use Cases of Interest
The question of use cases for data inevitably arises as the cost associated with building data-driven applications must be justified. While this question is natural, the first thing to realize is that a majority of the associated cost is in the deployment of the sensor system and the collection of the data. Leveraging existing data is the least expensive part. As an example, we look at the Waze navigation app for smartphones. For $67 million in total investment, Waze built the data infrastructure to manage a $10 billion network of 50 million advanced sensors with a concreate total value creation defined by the acquisition of the entire company for nearly a billion US dollars.
Some of the use cases for collected data are known ahead of time. In the case of PMU data, it is obvious that sampling the grid at a substantially high frequency than existing SCADA systems (30 Hz vs 0.25 Hz) provides a mechanism to validate (or invalidate) existing models of the grid. Phase angle monitoring and oscillation detection are two other common use cases that can be addressed with PMU data. However, the more interesting and more valuable use cases for data are those that cannot be clearly discerned at the time the data was first collected. Often, the most value can be created from those use cases that fall into the unknown, unknown category.
As an example of this, we look at Netflix, the movie and television streaming service. Netflix was founded in August 1997 and launched its DVD by mail service in April of the following year8. It quickly became apparent that the economics of the business model did not work; the newest DVD releases, which were the least cost effective for the business, were virtually the only movies being selected by customers. In 1999, Netflix started repurposing data they had collected from customers in the form of movie ratings, along with an understanding of each movie’s content, to start providing individualized content recommendations for each user. This was possible using a number of data science techniques such as collaborative filtering and grew into the company’s proprietary Cinematch algorithm. This aspect of the business has become so crucial that Netflix’s annual spend on content discovery exceeded $150M annually in 20149.
As an unexpected use case that could be addressed, PingThings demonstrated last year that PMUs could be used to computed the reactive power consumed by an auto transformer during a geomagnetic disturbance. This creates the very real possibility of potentially monitoring the power grid for geomagnetically induced currents not by installing costly sensors but by leveraging PMUs.
Beyond unexpected use cases, utilities are faced with additional challenges, such as the need to improve operational and capital costs, facilitate intermittent renewables, and meet more stringent reliability standards in the face of disruptive loads and changing weather patterns. To that end, utilities are becoming interested in applying cross-departmental approaches to gathering information to develop a more holistic asset management and condition monitoring (AMCM) strategy. These approaches entail a better understanding of asset states and using this knowledge to develop a predictive risk-based management strategy—as opposed to responsive. According to Navigant Research, global revenue for power AMCM devices and solutions is expected to grow from $2.6 billion in 2016 to $6.5 billion in 2025.
3Capability - Ability to Access and Use Data
While successfully capturing and archiving high quality data are the first steps to creating data-driven applications, they are certainly not the last. Utilities or utility partners must be able to access and use all of the data to prototype, build, test, and then deploy data-driven applications. To do this requires software frameworks for processing data at scale and while streaming.
Fortunately for the power industry, not only have other industries advanced related technologies making these requirements possible, both the hardware and software costs have rapidly plummeted over the last two decades.
3.1Moore’s Law
Gordon Moore, one of the co-founders of Intel, made an observation in an appropriately titled magazine article -- Cramming more components onto integrated circuits -- that proclaimed the number of components per integrated chip would double every year. This doubling of component density has allowed processors to double in performance approximately every 2 years for the last half century, enabling everything from the Internet to smartphones10.
From the electric utility’s perspective, Moore’s law has unlocked incredible computational possibilities at exponentially decreasing cost. The chart below compares shows the exponential decrease in cost for the three core assets of a computer: processing power, volatile memory size, and non-volatile memory size.
The processing speed of the microprocessor has dropped in cost by 1.4 million times. The cost of main memory has decreased by a factor of 6,400 and the cost of permanent storage has fallen by a factor of 1.5 million.
Put another way, it is possible to purchase enough volatile system memory (RAM) to hold a month’s worth of data for all PMUs in North America for approximately $10,000. To put this in perspective, the world’s fastest supercomputer in 1995, Fujitsu’s Numerical Wind Tunnel, could not do this11. Further emphasizing this point, consumer game consoles available today have sufficient hard drive storage space to archive several months of PMU data for the United States of America.
3.2The Evolution of Big Data Software
Moore’s law has enabled the hardware foundation to be built upon which big data is possible. Fortunately for the utility industry, the software side of the equation has kept pace. To gain an overview of the rapid evolution of big data, the traditional engineer only needs to look at the seminal flow of papers from Google. From this stream, one can see the sequence of big data challenges that Google faced and the technical approaches used to surmount them.
Starting in 2003, Google implemented a distributed file system (GFS) and a software infrastructure (MapReduce, the basis for Hadoop) to process data spread across thousands or millions of commodity, inexpensive computer hardware with relative transparency to the end user12, 13. This approach enabled orders of magnitude cost reductions when processing massive amounts of data. Per a conversation with a former Google VP, any software engineer at Google could run a job across 50,000 machines without manager approval in 2007.
Next, Google describes how it created numerous data storage and processing systems to handle all types of data – structured, unstructured, graph, and even globally distributed yet synchronized database – at Internet-scale14, 15, 16. The key to this innovation is that instead of requiring larger hardware to handle more data or more complex processing as had been the current paradigm, these systems could accommodate more by horizontally scaling across additional machines. This, again, radically changed the cost curve for handling big data.
Finally, Google discusses its framework and processing model for streaming computations at scale17. Historically, most data analysis has been done on finite or bounded data sets. For example, a professor is interested in looking at PMU data so the utility exports a large csv that can be loaded in Excel. Even in older big data processing frameworks like Hadoop, processing is done in batches, on finite chunks of data. In the real world, many data sets are infinite with new data constantly arriving. This is especially true for utilities and other industrials where sensor data is continuously being generated. Google’s dataflow framework allows for analyzing and processing data streams with the assumption that new data will always arrive, that old data may be retracted, and that batch data processing is just a special case.
Where Google has led the way, open source (and free) software solutions have eventually followed. Today, there is a rich ecosystem available that can accommodate the utilities’ big data needs. Just as Moore’s Law has helped hardware costs exponentially drop, we have seen similar behavior in the big data software space. However, these technologies represent a complete departure from the solutions and methodologies that the utility industry is accustomed to and also require a different mentality and skill set to leverage fully.
Conclusion
The electric utility industry has made a significant and public investment in the deployment of PMUs. All of the necessary ingredients are available to leverage this data to produce far greater ROI than had originally been anticipated. Data quality is a solvable issue; it is not a technology nor algorithm problem, but one of organizational will. Further, significant motivation exists in many forms. PMU data can clearly be used to reduce unnecessary costs for utilities and even previously unknown use cases such as GMD monitoring, are possible. Finally, other industries have evolved the state of the art in distributed compute and storage systems to surpass the current needs of the utility industry.
Some may say that data quality is a catch 22 for the industry. Without obvious benefits, there is no reason to get data quality under control. However, without good data quality, it is not possible to build applications that actually solve a relevant issue. This is incorrect. Even if we ignore the current PMU application areas, the tantalizing prospects of unsolved but valuable issues around reliability that could be addressed, and the understanding that the most valuable use cases for next generation sensor data have probably not yet been conceived, there is still the issue of liability. Data, on its own, is a liability; if it is not cleaned and used, then utilities open themselves to uncomfortable questions from regulators, policy makers, and the general public.
While this paper focused primarily on data-driven applications based on PMU data, there is no reason to limit ourselves to synchrophasors as phasors approximate the waveform being measured. Internally, PMUs are sampling the waveform several dozen times per cycle and to extrapolate a simplified model of the current and voltage waveforms. From a data perspective, this represents a one to two orders of magnitude of down sampling the original data. The relevant question is why? Why not just sample current and voltage waveforms directly at several kilohertz. This is already done by the Digital Fault Recorder (DFR), which samples up to 10 KHz when a particular state occurs. Due to the high data rate, only a very brief time period of data is captured. However, this is a technical limitation only; the ability to store, analyze, and use this volume of data was historically cost prohibitive but not so now.
BIBLIOGRAPHY
- [1] Steinmetz, C., (1893). "Complex Quantities and Their Use in Electrical Engineering".Proceedings of the International Electrical Congress, Chicago. Chicago, Illinois 1893 conference of the AIEE:American Institute of Electrical Engineers Proceedings: 33–74.
- [2] 1344-1995 IEEE Standards for Synchrophasers for Power Systems, http://ieeexplore.ieee.org/xpl/freeabs_all.jsp?arnumber=943067&isnumber=20419 (1995).
- [3] Advancement of Synchrophasor Technology in Projects Funded by the American Recovery and Reinvestment Act of 2009, March 2016, US Department of Energy
- [4] A. von Meier, D. Culler, A. McEachern and R. Arghandeh, “Micro-Synchrophasors for Distribution Systems.” IEEE Power & Energy Society Innovative Smart Grid Technologies Conference, Washington DC, Feb 2014.
- [5] Dragomir Anguelov, Carole Dulong, Daniel Filip, Christian Frueh, Stéphane Lafon, Richard Lyon, Abhijit Ogale, Luc Vincent, Josh Weaver, "Google Street View: Capturing the World at Street Level", Computer, vol.43, no. 6, pp. 32-38, June 2010, doi:10.1109/MC.2010.170
- [6] M. Palmer, “Data is the new oil,” http://ana.blogs.com/maestros/2006/11/data_is_the_new.html
- [7] New technology can improve electric power system efficiency and reliability, March 30, 2012, http://www.eia.gov/todayinenergy/detail.cfm?id=5630
- [8] https://media.netflix.com/en/about-netflix
- [9] N. Hunt, “Quantifying the value of better recommendations” (RecSys 2014, Keynote, https://www.youtube.com/watch?v=lYcDR8z-rRY)
- [10] G. E. Moore, "Cramming more components onto integrated circuits" (Electronics Magazine, 1965. http://www.cs.utexas.edu/~fussell/courses/cs352h/papers/moore.pdf)
- [11] https://www.top500.org/lists/1995/11/
- [12] Ghemawat, S., Gobioff, H., and Leung, S. "The Google File System. "Proceedings of the Nineteenth ACM Symposium on Operating Systems Principles - SOSP '03(2003).
- [13] Dean, J. and Ghemawat, S.. 2004. MapReduce: simplified data processing on large clusters. In Proc. of the 6th conference on Symposium on Operating Systems Design & Implementation - Volume 6 (OSDI'04), Vol. 6. USENIX Association, Berkeley, CA, USA, 10-10.
- [14] Chang, Fay; Dean, Jeffrey; Ghemawat, Sanjay; Hsieh, Wilson C; Wallach, Deborah A; Burrows, Michael ‘Mike’; Chandra, Tushar; Fikes, Andrew; Gruber, Robert E (2006), "Bigtable: A Distributed Storage System for Structured Data", Research (PDF), Google.
- [15] Malewicz, Grzegorz, et al. "Pregel: a system for large-scale graph processing." Proceedings of the 2010 ACM SIGMOD International Conference on Management of data. ACM, 2010.
- [16] James C. Corbett, Jeffrey Dean, Michael Epstein, et al . 2013. Spanner: Google’s Globally Distributed Database. ACM Trans. Comput. Syst. 31, 3, Article 8 (Aug 2013).
- [17] Akidau, Tyler, et al. "The dataflow model: a practical approach to balancing correctness, latency, and cost in massive-scale, unbounded, out-of-order data processing." Proceedings of the VLDB Endowment 8.12 (2015): 1792-1803.