From AMI to synchrophasors and beyond.
All of your sensor data in one place instantly at your finger tips.
What is the PredictiveGrid™ ?

A horizontally scalable, ultra-high performance platform for time series data of any frequency ...
Extreme Read and Write Performance
Read and write tens of millions of data points per second per node with excellent horizontal scaling.
Independently Scalable Compute and Storage
Tailor platform performance and scale to the exact needs of your organization and sensor fleets.
Exponentially Accelerated Queries
Common data access patterns are accelerated 10,000x beyond our already blindingly fast speeds.
... that can handle and version all of the data
needed to place sensor data in physical context.
Time Series
Ingest data from virtually any type of sensor or system.
Metadata
Capture all of your essential asset and sensor information.
Geospatial
Geospatial data is a must to place sensors in the real world.
Topology
Network topology impacts data comprehension.

All the built-in power tools to understand,
analyze, learn from, and build with data.
Real-time & All-time Analytics
Work with the last moment of measurements or all of your data. Don't be limited by just real-time.
Machine
Learning
and AI
Use best-of-breed open source ML and AI tools for anomaly detection, prediction, and more..
Rapid Analytical App Development
Build custom, web-based analytical applications in Python without needing web technologies.
Data Collaboration and Governance
Securely and trivially share data and findings with colleagues across the hall or across the globe.
Extensive APIs for all Services
Extensive and performant APIs for working with your data in your preferred language.
Simple Dashboard Development
Easily build and deploy web-based dashboards driven by your data and information.

A rapidly growing suite of applications
driven by sensor data and
an active, expert user community.
Instantaneous Data Visualization
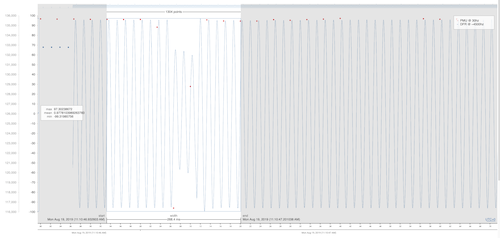
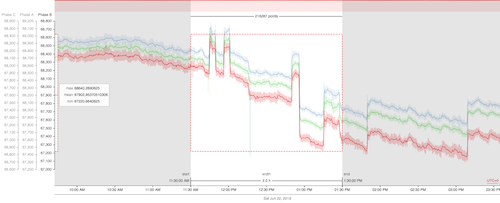
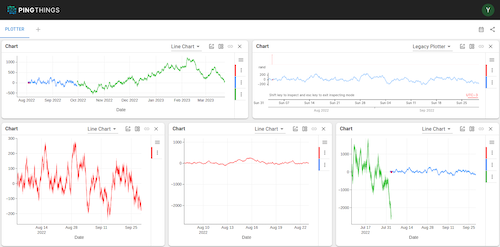
Effortlessly interact with all of your data regardless of the sample rate of the sensor or the number of streams. Any and all work with time series data starts with understanding the streams.


Custom Dashboards
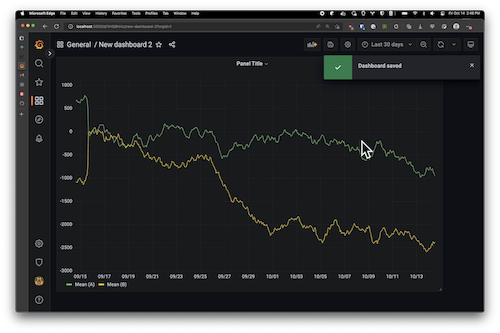
Design, build, and deploy custom dashboards driven by any and all of the data in the PredictiveGrid platform easily and quickly using our customized Grafana backend.
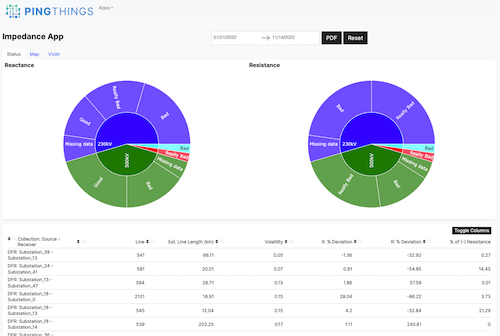
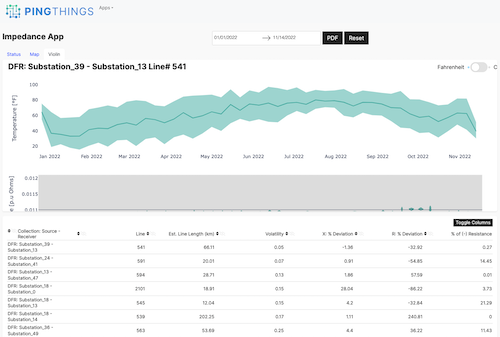
Low-Code Analytical Applications
Data at rest is useless. With the PredictiveGrid, your engineers and data scientists can easily build and iterate on analytical applications securely running as web applications without need front end engineering support or development. Unleash the talent that you already have to develop the next generation of grid applications.
